Mobility
Mobility is defined as a change of address within the five years preceding the census date.
Several different types of mobility exist, including the following:
- Non-movers: persons living at the same address as they did five years ago.
- Movers: persons living at a different address than they did five years ago as categorized by:
- Non-migrants: persons who moved but still reside within the same area municipality as they did 5 years ago.
- Intra-provincial migrants: persons who moved to a different area municipality but still reside in the same province as they did 5 years ago.
- Inter-provincial migrants: persons living in a different province or territory than they did 5 years ago.
- External: persons who moved to Canada from a different country.
Mobility is measured at the area municipal level. Therefore, non-migrants include only those movers who remained within a particular area municipality. Similarly, the data for intra-provincial migrants includes people who have moved from one area municipality to another. For example: people that moved from Mississauga to Caledon would be considered intra-provincial migrants.
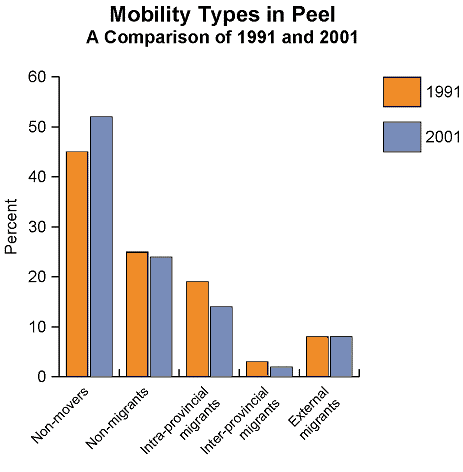
In 2001, all regions within the GTA had a larger number of non-movers than movers. Durham had the lowest proportion of movers, at 42.4 per cent, while Peel had the highest, at 47.7 per cent. Non-movers accounted for 52.3 per cent of Peelís population. In 1991, movers accounted for 55.9 per cent of Peelís population, while only 44.1 per cent had remained at the same address.
In 2001, slightly more than half of the movers in Peel were non-migrants; that is, they had moved only within their area municipality. Again, this contrasts with the situation in 1991, when there were more migrants than non-migrants.
Intra-provincial migrants and inter-provincial migrants both experienced a drop as a percentage of the total population between 1991 and 2001. Intra-provincial migrants decreased from 18.6 per cent to 13.7 per cent of the population from 1991 to 2001 while inter-provincial migrants experienced not only a drop in share but also a drop in total numbers, decreasing from 22,410 persons to 18,955 in 2001.
 Chart
Chart
Comparison of Mobility Types in Peel, 1991 and 2001

Source: Statistics Canada, 1991 and 2001 Censuses
 Other Resources
Statistics from the 1996 Census on a variety of topics.
Statistics from the 2001 Census on a variety of topics.
Statistics from the 2006 Census on a variety of topics.
Information from the 2001 Census for each ward in Peel.
In-depth reports on topics such as age and sex, education and earnings, home languages, households and dwellings, immigration and more.
Regional orientation maps and maps of areas used for analyzing data.
Regional orientation maps and maps of areas used for analyzing data.
Please send comments and questions to:
Peel Data Centre
Region of Peel
Digital and Information Services,
Information Management Division
10 Peel Centre Dr., Suite A, 6th Flr.
Brampton, ON L6T 4B9