Illustration of Emerging Trends
Participation and Activity Limitation Survey (PALS):
In 2006, an estimated 4.4 million Canadians—one out of every seven in the population—reported having a disability. This is an increase of over three-quarters of a million people in five years.
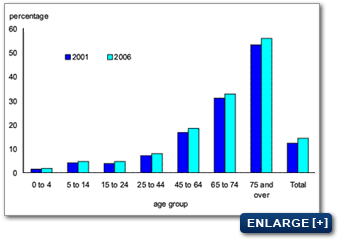
Data collected from the Participation and Activity Limitation Survey (PALS) in 2001 indicated that 12.4 per cent of the population reported a disability. By 2006, this rate had increased to 14.3 per cent of the population.
Disability rate by age, Canada, 2001 and 2006
**Source: Statistics Canada, Participation and Activity Limitation Survey, 2001 and 2006.
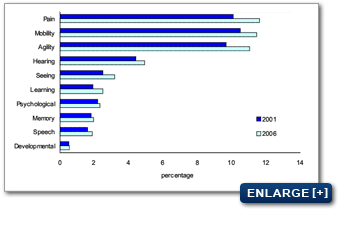
Disability rate by type of disability for persons 15 years of age or older, Canada 2001 and 2006
**Source: Statistics Canada, Participation and Activity Limitation Survey, 2001 and 2006
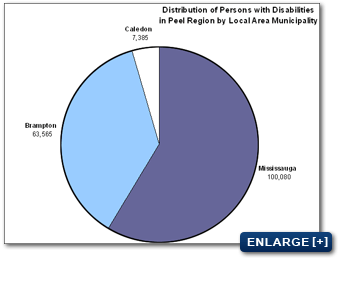
Persons with Disabilities Living in Peel Region
**Source:Peel Data Center,Statistics Canada, Participation and Activity Limitation Survey 2006.
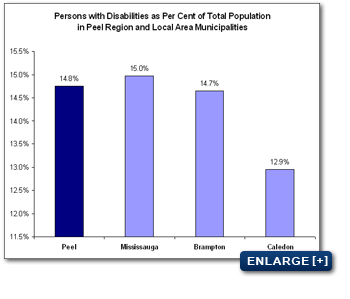
Persons with Disabilities as Per Cent of Total Population
in Peel Region and Local Area Municipalities
**Source: Peel Data Center, Statistics Canada, Participation and Activity Limitation Survey 2006.
Percentage of Persons with Disabilities in the Labour Force
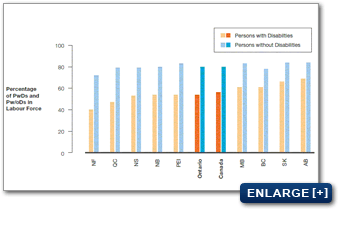
PwDs: Persons with Disabilities
Pw/oDs: Persons without Disabilities
** Source: Statistics Canada. Participation and Activity Limitation Survey, 2006.
In 2006, Ontarians without a disability earned approximately $40,500 in employment income, while Ontarians with a disability earned only $29,000. This income difference between the two groups is approximately 28 per cent.
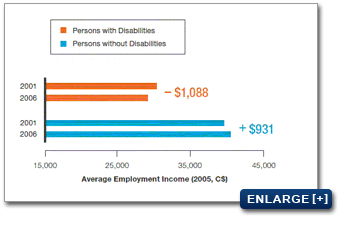
**Source: Statistics Canada. Participation and Activity Limitation Survey, 2006.
Benefits of the Increased Accessibility in Ontario
In 2009, the Government of Ontario commissioned a study to investigate the potential economic impact of five AODA standards. The study Releasing Constraints: Projecting the Economic Impacts of Increased Accessibility in Ontario has concluded that the demand for accessible goods, services, buildings, and employment is not only high but growing, and will overtake the demand for their conventional counterparts. A notable area of the study finding is determining the economic impact of increased employment accessibility for Ontarians with disabilities, which will lead to an increase in the average income of all Ontarians and to a significant reduction in the money spent by the government to provide income support through the Ontario Disability Support Program (ODSP).
There are multiple reasons and barriers that could place people with disabilities in lower income quintiles. The reasons for this disadvantage are complex. For a detailed explanation, please refer to page 9 of the study.
With an aging population in Ontario, many studies are predicting a labour shortage and a rise in demand for additional workers in the future. Some of these shortages can be filled by persons with disabilities, if the supports mandated by the proposed AODA standards are implemented successfully.
If AODA employment standards are effectively implemented and the standard result is a 2 per cent increase in the employment numbers of persons with disabilities (from 50 to 52 persons) the employment income in Ontario will change by $359 million. At the same time, it would decrease the Ontario Disability Support Program (ODSP) payments made by the Government of Ontario by $151 million. This calculation is based on the minimum ODSP payment, including a basic needs allowance of $566.00 and shelter allowance of $454.00 per month.
According to the study, with a 2 per cent increase in the employment rates of persons with disabilities, the combined economic benefit to Ontario from the increase in employment income and decrease in ODSP payments would be approximately $510 million. Using this case scenario, the increase in employment income will result in an increased GDP by $4.1 billion. Therefore, the increase in Gross Domestic Product (GDP) per capita across Ontario would be $49.
With the introduction and successful implementation of AODA standards one can hope that it may reduce the inequality and increase income levels of employment for persons with disabilities and will benefit all Ontarians. The effectiveness of the standards development and their implementation are a key success factor for projections and estimates outlined in the study. The study assumes that all standards will be well designed and widely adopted by all AODA sectors and will result in a marked increase in employment and education. It does not anticipate that the standards will remove the need for targeted disability needs by the Ontarians with disabilities.
The following examples will illustrate the scenarios that researchers used in calculating the total benefit to the Ontario economy if there is an increase in the employment participation of persons with disabilities in Ontario as a result of effective AODA implementation.
Scenario 1:
2 per cent increase in employment numbers (an additional 12,316 individuals employed) According to scenario 1, across Ontario, GDP per capita will increase $49.
Scenario 2:
Assuming that with successful implementation of the AODA standards, an additional 14,160 individuals, who previously were unable to work due to lack of accommodations, would now be able to find work. This number represents those individuals who reported that with proper workplace accommodations they are able to work despite having a disability (PALS 2006). According to scenario 2, across Ontario, GDP per capita will increase $60.
Impact on Ontario’s economy
Increase in GDP per capita due to higher participation of persons with disabilities
(using wages and GDP relationship) (C$)
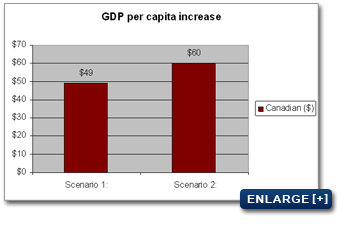
Scenario 1: 2 % increase in employee numbers (12,316 individuals employed)
Scenario 2: All work accommodations met (14,160 individuals employed)
** Source: Institute for Competitiveness & Prosperity analysis based on the data from Statistics Canada, Participation and Activity Limitation Survey (PALS), 2006.
- top -