Appendices
Appendix IV
Participation and Activity Limitation Survey (PALS):
An estimated 4.4 million Canadians—one out of every seven in the population—reported having a disability in 2006. This is an increase of over three-quarters of a million people in five years.
Data collected from the Participation and Activity Limitation Survey (PALS) in 2001 indicated that 12.4 per cent of the population reported a disability. By 2006, this rate had increased to 14.3 per cent of the population.
Disability rate by age, Canada, 2001 and 2006
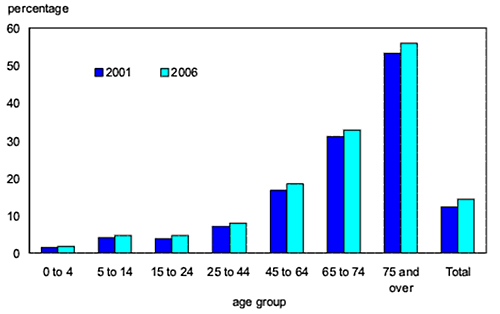
Source: Statistics Canada, Participation and Activity Limitation Survey, 2001 and 2006.
Children with a Disability in Canada:
Population aging is only one factor that has contributed to the increase in the disability rate since 2001. Disability rates have increased for nearly all age groups.
Among children aged 14 and under, an estimated 202,350 reported a disability of some kind in 2006, or 3.7 per cent of that age group. This proportion was up from 3.3 per cent in 2001.
Chronic health conditions affected 69.8 per cent of children aged 4 and under and 66.6 per cent of children aged 5 to 14.
Approximately half of all children aged 4 and under reported a single disability in 2006. Slightly more than 40 per cent reported two disabilities, and just less than 9 per cent reported three or more.
Approximately three-quarters of school-aged children with a disability reported having multiple disabilities, while only 26.3 per cent experienced a single disability.
For children aged 5 to 14 with disabilities, the greatest proportion reported having a mild disability (33.5 per cent), followed by moderate (24.1 per cent), severe (23.5 per cent) and very severe (18.9 per cent) disabilities.
Source: Statistics Canada, Participation and Activity Limitation Survey, 2001 and 2006.
Disability rates by type of disability for children aged 5 to 14 years, Canada, 2001 and 2006
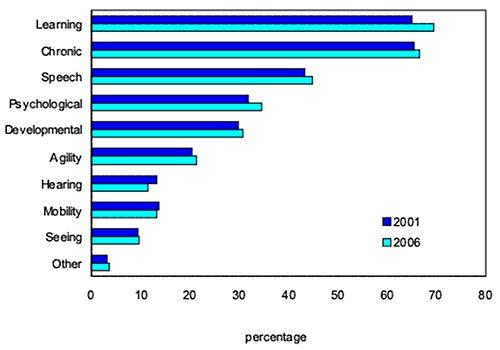
Source: Statistics Canada, Participation and Activity Limitation Survey, 2001 and 2006.
Disability rate by type of disability for adults 15 years of age or older, Canada 2001 and 2006
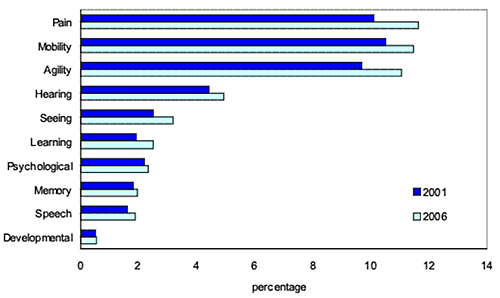
Source: Statistics Canada, Participation and Activity Limitation Survey, 2001 and 2006.
Region of Peel Statistics
The Region of Peel is one of the most rapidly growing communities in the Greater Toronto Area and Hamilton (GTAH) area. It is made up of the City of Mississauga, the City of Brampton and the Town of Caledon.
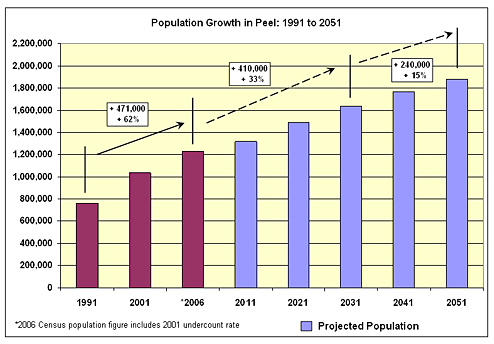
Peel Region has experienced significant growth over the past decades and will continue to do so in the future. Between 1991 and 2006, Peel Region experienced an increase in population from approximately 760,000 in 1991 to 1.2 million. Over the next 25 years, it is expected to increase to 1.64 million by 2031. Figure 1 below provides an indication of growth in the Region. It must be noted that major future population growth can be attributed to the City of Brampton. The below population forecasts for 2041 and 2051 are not approved by Council but used for illustration purposes.
Figure 1: Population Forecasts in Peel
As per 2006 Census data, the Region has an over 55 (older adult) population making up about 19 per cent of the total population. However, by the year 2031, it is estimated to increase to about 33% and by 2051 it is estimated that 38 per cent of the total population will be older adults. In terms of the over 75 age group, more than 42,000 people were older than 75 years of age in 2006; in 2031 this figure will increase to nearly 140,000. This is more than three times as many people over the age of 75 as today. It is estimated that in 2051, the over 75 years’ age group will be the largest age group in the Region with over 260,000 people. Figure 3 below provides a picture of the number of older adults in Peel between 1991 and 2051. Please note that forecasts for 2041 and 2051 are not approved by Council but used for illustration purposes.
Figure 3: Older Adults in Peel Forecasts
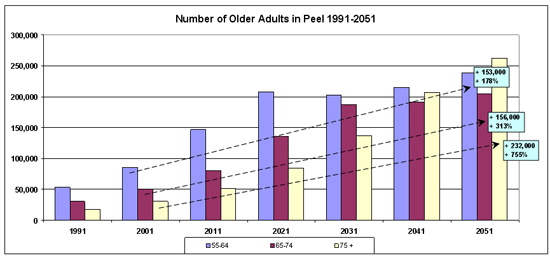
Source: Statistics Canada, 1991, 2001 and 2006 Censuses and Planning Policy and Research Division Forecasts.